

App Marketing Costs and How to Calculate Your Budget
Fulfilling your dream of being a successful app developer is not sorcery: It takes hard work, dedication and making the right decisions. After writing the code for and designing your app, you also have to consider your app marketing costs and how to spend your budget most effectively.
We have mentioned the different ways to calculate your budget many times on this blog. However, in order to give you a complete overview of this topic, we have listed the most important calculations in this article and seperated them in two categories:
- Calculations involving capital, whether spent on or received by your customers.
- Calculations on how frequently a user interacts with your app.
Firstly, select your key performance indicators (KPI), which enable you to make smart business decisions about the direction of all current app related projects. Which KPI’s are important totally depends on you and your company.
Following this, we are going to present some of the most common budget calculations with regards to your user acquisition strategy.

Calculations Including App Marketing Costs and Revenue of Your User Acquisition
These kinds of calculations only work retrospectively, meaning that you need data from previous user acquisition campaigns or you need to analyze your running campaigns. This is a very interesting aspect because you get numbers to calculate the app marketing costs and a relation to other parts of the development process.
Let’s assume this: You can spend $10,000 for your marketing campaign. What will the outcome be?
Cost Per Install
The Cost per Install (CPI) measures the app marketing cost that you carry for ads that trigger an installation of your app.
CPI varies much according to the ad formats you use. If you are using non-incent banner ads, you will most likely pay much more for each install than when buying downloads via an incentivized offerwall. If you use an incentivized offerwall, you can calculate exactly how many installs you will get for a certain amount of money.
So, if you use a professional advertiser and agree on a price i.e. of $0.20 per install, you can generate 50.000 installs with your marketing budget of $10,000 – a very clear result when calculating the app marketing costs.

Cost Per Acquisition
It is often called Cost Per Action, too. This simple but very interesting formular helps in calculating app marketing costs because you can measure very clearly how effective your marketing efforts are. It is not limited to a specific model like CPI or CPAU.
For the mobile advertising industry, this pricing type is more commonly used for setting actions like completing a tutorial, reaching a certain level, registering an account or subscribing for a newsletter.
The defined action can be as specific as needed.

Cost Per Active User
The Cost per Active User measures the app marketing costs that you need to spend in order to reach users that will use your app actively.
Every company needs to define for themselves what ‘active’ means. In this case, you might also hear the term ‘retention rate’. (Click here for more information regading retention rates.)
CPAU is always higher than CPI, since it is not realistic for all bought installs to convert into an active user. If you spent $10,000 for your marketing and generated i.e. 50,000 installs and 10% of these users turn into active users, you spent 2$ per active user – if this is the KPI you are looking for.
Active users are more likely to generate revenue for your busines, making your user acquisition efforts very valuable.

Average Revenue Per User
The Average Revenue per User is the amount of revenue each of your active customers (on average) contributes in a specific period of time.
This is a very good indicator in two ways:
- You can see how much money you get from a special group of your users that are very engaged with your app.
- When calculating ARPU and including normal users, you get insight about at which point normal users are converted to active users – a good side effect when calculating app marketing costs.

Customer Lifetime Value
The Customer Lifetime Value (CLTV) makes you predict how long your customer uses and generates revenue within your app and therefore, how much the user is worth for you.
It should always be your goal to improve app features that are the most likely increase the Customer Lifetime Value of your users. Most of the time this translates into improving retention rate, session duration and total usage time per user for your app.
The opposite might be the case, however, if you operate a shopping. For example, the session duration will be reduced by optimizing the check out process after a user has added an item to his/her basket.
This faster check out process might result in shorter session durations but higher CLTV in the long run. Thus, be aware of what KPI’s you have to measure and improve exactly.
With the CLTV in mind, you are now able to calculate how much you can spend for every user in order to still make profit – this is what the calculation of your app marketing cost is about.
The CLTV depends on three factors:
- Monetization (how much customers contribute to your mobile revenue),
- Retention (level of engagement a customer has with your app) and
- Virality (sum value of additional users a customer will refer to your app)
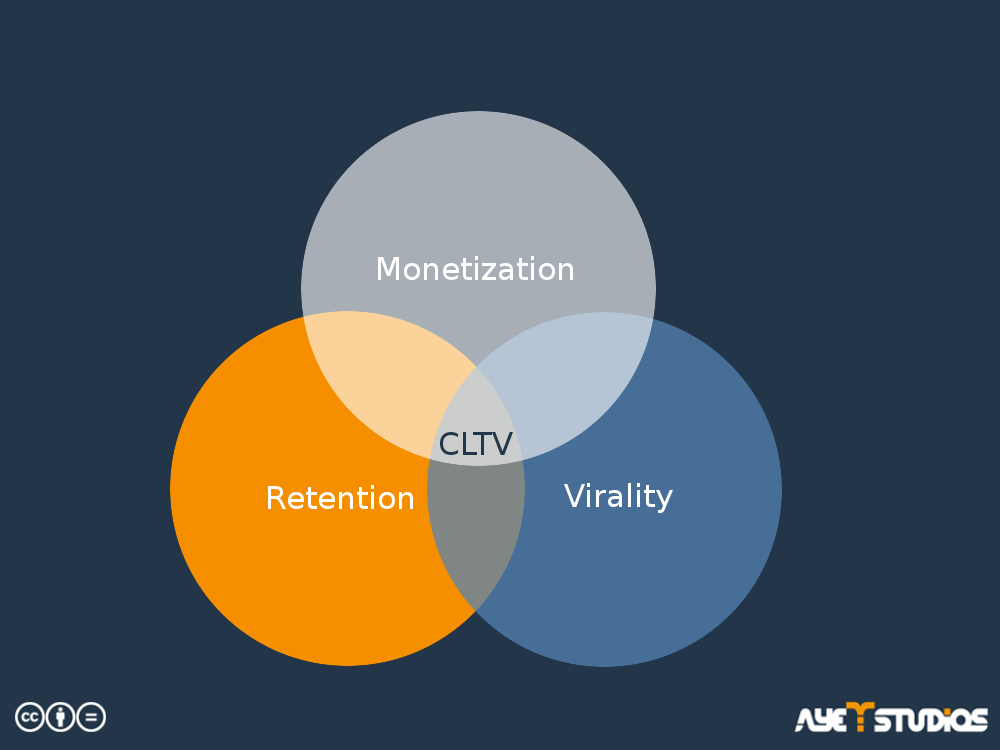
What Customer Lifetime Value (CLTV) depends on © ayeT-Studios
If you want to calculate the CLTV, use the following formula:

Following this link, you can read an article on how to find the right mobile ad format for your product.
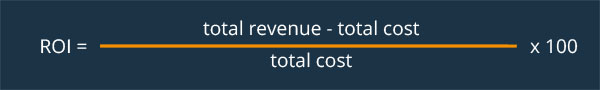
Return on Investment
Return on Investment signifies the profit you make with your app in comparison to your investment. You take a look at this at the end of your user acquisition campaign because it summarizes your efforts in making money by acquiring new users for your app.
In our case, we assumed $10,000 for app marketing costs. Let’s say the total revenue was $12,000, so your ROI for user acquisition was $2000. A high ROI means that your profit is way higher than your investment.
As long as your ROI is a positive value, you are not making losses. Be aware that you might want to measure additional spendings to CLTV and Ad Spending like all other costs of the business you operate (rent, HR, infrastructure and so on).
Conversion Rate
There are many different ways to calculate your conversion rate; it all depends on your goals and what is important for you.
You might want to measure more than just one conversion within your conversion funnel from user acquisition to revenue generated to calculate the app marketing cost. That way, you would be able to improve your app on a more sophisticated basis.
There are at least two conversions we find worth measuring for almost any app type:
- Installs / Active Users: You can calculate the number of users that installed your app based on your user acquisition campaign and then decided to take specified actions to convert into an active user.

- Active Users / User Generated Revenue: You can calculate the number of users that are using the app and then decide to take action and to generate revenue, for example by doing in-app purchases.

Calculations not Inlcuding App Marketing Costs
You can get very useful information to calculate your app marketing costs the right way without looking at financial aspects.
Important factors for your budget calculation are, for example
- how often users interact with your app.
- at which point you lose their attention.
Churn Rate
With the churn rate you can calculate the number of users that delete your app in a specific period of time. It is a valuable indication of your users’ satisfaction.

Monthly Active User (MAU) / Daily Active User (DAU)
These are your key users. Try to get as much information about this group as possible because it will help you improve your app.

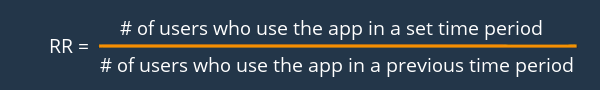
Retention Rate
This element indicates the percentage of customers you are retaining. The retention rate is not a defined term, you can measure different factors according to what you want to learn.
Daily Sessions Per DAU
Daily sessions per DAU helps you to determine whether or not your customers are returning to your app as often as you want them to.

Stickiness
This is an indicator for how many users engage with your app and a good measuring tool for you if you provide bigger updates for your app.

Session Length
If you measure session lengths, you can quantify the depth of a user’s relationship with your app.
App Launch / Load Time
Users want a fluent experience with your app, so keeping this number as low as possible is necessary.
As result, the KPI’s including money for calculations are not the only way to succeed. You need to know the behavior of your users; why and when they use your app.
Click here if you want to know more about the right way to promote your app.
Conclusion
In summary, we can state that calculating your app marketing costs (or the use of them) is not only limited to the factor of profit or revenue.
Retention rate, daily sessions per active users or session length are significant factors for the success of your app – and for the success of your business.
Try to aim for the KPI, which is most useful to your app marketing campaign and in this light, plan how to use your budget.
We at ayeT-Studios are an experienced team and can help you calculate the costs of your app marketing and lever your user acquisition.
Beneath, you can find information about our pricing:
| Rewarded Advertising |
Android (starting at) |
iOS (starting at) |
|---|---|---|
| CPI | 0,07$ | 0,15$ |
| CPE | 0,30$ | 0,30$ |
| CPA (Signup, Registrations) | On request | On request |
| Rewarded Video (CPV) | 0,020$ | 0,020$ |
| Rewarded Video (CPM) | 0,50$ | 0,50$ |
| Non-Rewarded Advertising |
Android/iOS/Website (starting at) |
|---|---|
| CPC | 0,02$ |
| CPM | 2,00$ |
| CPV | 0,02$ |
